
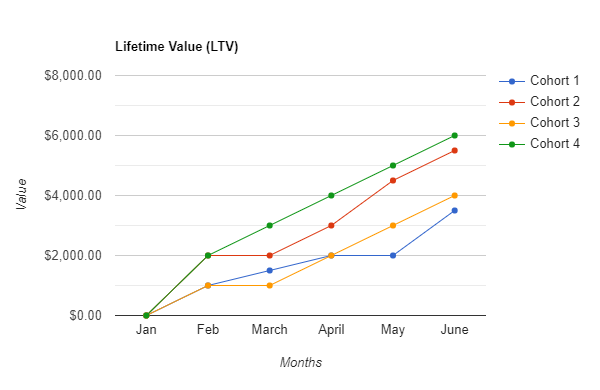
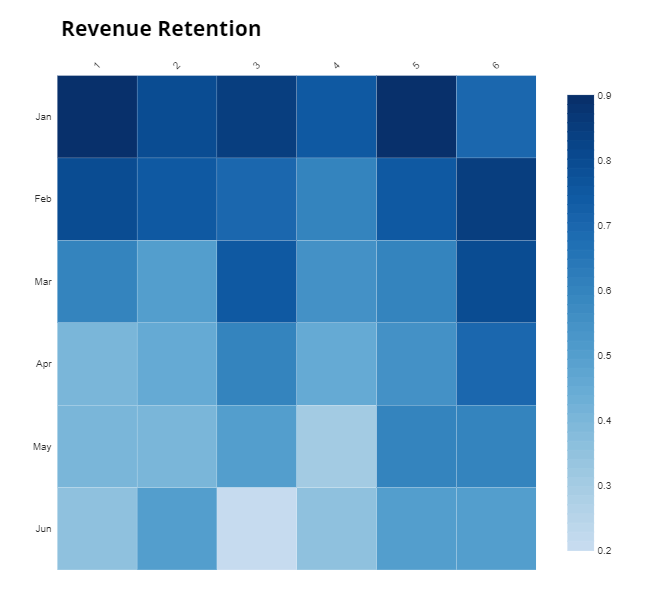
In our previous article, we talked about the importance of achieving Product-Market Fit using a tried and tested quantitative approach called Growth Accounting. Continuing our research, in this article, we will dive deep into Cohort Analysis. Cohort Analysis is another technique to analyze how far are we, as product builders, in attaining the Product-Market Fit for our Web3 product. This article will cover everything you need to know about Cohort Retention analysis, why it is a necessary metric to track, and how it can affect your product growth, direction, and vision. So if you are a Web3 product owner/builder/growth executive, you have come to the right place. Now, without further ado, let’s dive in! Before hopping onto Cohort Analysis, let’s first refresh our understanding of Product-Market Fit. PMF refers to the ideal alignment between a product's value proposition and the needs and desires of its target market. It signifies a point where your Web3 product resonates deeply with users, leading to sustainable growth and customer satisfaction. Uniswap exemplifies a DeFi product that has successfully achieved Product-Market Fit. By understanding the needs of cryptocurrency traders, offering a seamless user experience, providing liquidity and market depth, and prioritizing decentralization, Uniswap has become a leading decentralized exchange in the Web3 ecosystem. Its success highlights the importance of identifying market needs, addressing pain points, and delivering a user-centric solution to achieve Product-Market Fit in the Web3 space. Achieving the Product-Market Fit is a determining step in the product development journey. A make-or-break event. This is when you know if your Web3 product is something that people want or if it is replaceable. Furthermore, it determines how long will your product be valuable for your users. Many product owners assume that they would just wake up one day, run some analysis and determine if their Web3 product is Product-Market Fit. Sadly, that is not how this works. You have to work towards attaining the PMF. It is a long, ongoing process. It requires constant effort through analysis, consumer feedback, iterative product updates, and product strategy pivots to finally build something sustainable in the market. Considering the rapid evolution that happen in the Web3 ecosystem, product owners have to make quick decisions to keep up with the changing customer needs and the dynamic market. Cohort Analysis is a very helpful approach to tracking where your product stands in its journey of achieving Product-Market Fit. This techniques measure one of the most important metrics for any product, user retention over a specific period. Now, let's explore how Cohort Analysis can help you assess and maximize your Product-Market Fit. Cohort analysis involves grouping users who share a common characteristic or experience like when they became customers and studying their patterns and behaviors within a specific time frame. By analyzing these cohorts over time, you gain valuable insights into user behavior, engagement, and retention. These insights are instrumental in identifying patterns, trends, and potential areas for improvement for your Web3 product. The first step in cohort analysis is to pick out the key metrics to later segment your customers. These key metrics are a reflection of user engagement and retention and highly depend on the nature of your Web3 product. Some of the most common and effective metrics to track are: Lifetime Value (LTV) is a crucial metric that measures the cumulative activity and value generated by a customer cohort over a specific period, typically expressed in monetary terms. For example, let's consider a Web3 product called "Blockchain-based Gaming Platform." We can calculate the LTV for this product by evaluating the total revenue generated by a customer cohort within a fixed time period, such as 12 months, after their initial usage of the platform. This includes revenue from in-game purchases, transaction fees, or subscription models. The Lifetime Value Metric helps assess the long-term revenue potential and profitability of a customer cohort. Revenue Retention is a metric that indicates the percentage of a customer cohort's initial revenue or activity that is retained over a specific time period. It helps evaluate the revenue stability and growth potential of a Web3 product. Moreover, Revenue Retention assesses the ability of a customer cohort to sustain their level of economic activity within the platform. For instance, in the case of a "Decentralized NFT Marketplace," We can calculate Revenue Retention by comparing the total revenue generated by a cohort of users in the initial period (e.g., the first month) with the revenue generated by the same cohort in a subsequent fixed time (e.g., the twelfth month). Revenue Retention reflects the product's ability to engage users and encourage continued transactions and interactions. Customer Retention, also known as Logo Retention, measures the percentage of a customer cohort's initial customers who continue to actively use or pay for a Web3 product over a specific period. It focuses on user retention rather than revenue specifically. Let's consider a "Cryptocurrency Wallet" as a Web3 product example. Customer Retention could be calculated by determining the percentage of customers who continue to use the wallet and perform transactions in the platform after a set period (e.g., 12 months) from their initial sign-up. Customer Retention is essential for assessing the stickiness of a product and the ability to retain and satisfy users. It helps gauge the effectiveness of the product's value proposition, user experience, and ongoing engagement initiatives. Now let’s explore the actual cohort creation. This is the next step in the cohort analysis to find your product-market fit. Once you have picked out the relevant key metrics for your Web3 product, you are ready to create the cohorts. By segmenting your user base into meaningful cohorts, you can gain insights into how different user groups respond to your product and iterate accordingly. Remember, these cohort dimensions should strongly align with your Web3 product’s goal and the insights you are keen on gaining. Once you have determined the cohort dimensions, gather the necessary data to populate these cohorts. This may involve collecting user data, transaction data, and other relevant information specific to your Web3 product. Ensure that the data is accurate, reliable, and properly organized for cohort analysis. When developing a Web3 product, it can be difficult to gather your user’s data, especially if said data is decentralized. For this, you can use certain analytics tools like Spock Analytics that can help you extract publicly available on-chain and off-chain data for your decentralized application. Using the defined dimensions and collected data, assign users to their respective cohorts. This process involves categorizing each user based on their relevant characteristics or experiences. Work smart and utilize appropriate data management tools and data analysis techniques to automate this assignment process if your user base is large. With the cohorts created and users assigned, it's time to analyze their behavior and track their engagement and retention over time. This involves monitoring key metrics within each cohort, such as the ones mentioned above. One of the most important aspects of Cohort Analysis is visualizing the data in a readable way. The better you can represent this data, the easier it will be to understand it and make data-driven decisions. Ultimately contributing to you achieving the product-market fit. Line graphs are a very simple and easy way to visualize cohorts. Take the following example of the graph that we have plotted for the Customer Lifetime Value (LTV): Note: This is a graph based on artificial data. The horizontal axis indicates the time in months, whereas the vertical axis represents the amount that the cohort is paying. You can see here that the cohort lines are moving in an upward direction. This indicates that the users after onboarding are paying more for your product as time progresses. Hence, seeing this trend, you can deduce that your product is very valuable to your target market and you are definitely in a strong position of attaining the Product-Market Fit. A similar approach could be taken for the other two metrics i.e. revenue retention and customer/logo retention. Constructing heat maps is another way to visualize your data. Here we have done so for revenue retention. Note: This is fabricated data and does not relate to any real-world application Here, the data is shown through a period of six months in the essence of the revenue retention rate for each cohort. If you notice the trend and read the data vertically (top-down), you will notice a decrease in retention. This could be due to factors such as increasing the product pricing, or your users are no longer interested in paying for your product. You can also create heatmaps for other metrics like LTV and Customer Retention. Cohort analysis is an iterative process. Use the insights gained from analyzing cohorts to inform product enhancements, messaging improvements, and user experience optimizations. It is important to implement these changes and track their impact on cohort behavior over time to gain a bird’s eye view of your product growth. Furthermore, continuously iterate and refine your strategies to align your Web3 product with the needs and preferences of your target market to maximize your Product-Market Fit Now that we know in detail about Cohort Analysis and how it helps position your product in the Web3 market, let’s take a look at some key points regarding how you can determine if your product has reached the holy Product-Market Fit: In the dynamic and rapidly evolving world of Web3 products, finding Product-Market Fit is crucial for success. Cohort Analysis emerges as a powerful tool to understand user behavior, engagement, and retention over time. By dissecting cohorts, identifying key metrics, and iteratively improving your product offering, you can increase the likelihood of achieving Product-Market Fit for your Web3 venture. Product-Market Fit
Is Product-Market Fit achievable?
Cohort Analysis
How does Cohort Analysis work?
Identifying the Key Metrics for your product
Lifetime Value (LTV)
Revenue Retention
Customer (Logo) Retention
Creating & Managing Cohorts
Define Cohort Dimensions
Gather and Organize Data:
Assign Users to Cohorts:
Analyze Cohort Behavior:
Representation of Cohorts
Line Graphs
Heat Maps
Iterate and Optimize
How to know if you have achieved Product-Market Fit?
Conclusion
Signup for The Vulcan Voice newsletter now and stay ahead of the curve!
Signup for The Vulcan Voice newsletter now and stay ahead of the curve!
Design partner